Visualizing AWS VPC Flow Logs in a Graph
Basics: What is a VPC? #
AWS’s concept of your own private “logically isolated section of the cloud” is called VPC (virtual private network).
The idea is that you get to control your own part of the cloud, set up firewalls and traffic rules, and put AWS resources like EC2 instances in a VPC.
A VPC has an IP CIDR block that you can freely choose. For example: if you assign the CIDR block 10.0.0.0/16 to your VPC, it will contain the following 2^16 local IPv4 addresses:
10.0.0.010.0.0.1- …
10.0.255.255
The /16 specifies how many bits from the prefix are constant. In this case, the first 16 bits from the IP address 10.0.0.0 are constant, while the last 16 bits are unspecified. This means that all IP addresses in this CIDR block share the prefix 10.0.. Each instance you put in your VPC gets assigned a local IP from the VPC’s pool of IP addresses.
You can subdivide your VPC into multiple subnets, each with their own CIDR block that is a subset of the VPC’s CIDR block. For example, a subset of the CIDR block examined above would be 10.0.0.0/24, which contains the 2^8 IP addresses from 10.0.0.0 to 10.0.0.255 (because the first 24 bits, 10.0.0., are constant).
VPC Flow Logs #
In order to monitor, debug or understand traffic in your VPC, AWS offers a feature called VPC Flow Logs. You can create a flow log for a VPC or subnet (or just a single network interface), and while it is active, the traffic is monitored and logged to a flow log records file, with one flow per row. These records (which are logs over a given time span, e.g., 60min) can be published to AWS CloudWatch or AWS S3.
Each log row describes one single network flow in the VPC (e.g., one request). It contains different fields that describe the type, source address, destination address, size, time and duration of the network flow (and others, check the full list here).
If you have a lot of traffic going on in your VPC, the long lists of flow logs in your records are hard to read. If you are not debugging some specific problem and just want to understand your VPC better (in order to optimize it), a graph can be really useful to display the records. This is where my project comes in.
Project Overview #
Motivation: Why Analyze Flow Logs? #
The motivation behind the VPC flow log analysis project was to understand what is going on in our VPC. This particular VPC contains a mobile app backend distributed across multiple instances with a load balancer, a Redis cache and a database (among other services), so there is quite a lot of different traffic flowing through the network. The AWS security checklist lists VPC flow logs as one important tool for incident & vulnerability detection. Thus, as a security audit procedure, I wanted to analyze the traffic in the VPC to make sure what I expect is happening is actually happening. (Side note: if you want to automatically detect security incidents on an ongoing basis, you should continually let some script analyze VPC flow logs and set up alerts if unwanted traffic is detected. There are some services that can do that for you. What I describe here in this post is more of an on-demand analysis.).
Project Structure #
The project consists of two main components:
- The graph generator is a simple script responsible for loading the VPC logs from AWS S3, parsing them and cleaning them up. It’s written in TypeScript.
- The client consists of a web page that loads the graph data from the
graph.jsonfile and displays it using vis-network, a JS graph visualization framework.
You can find the full code on GitHub. In the following I will describe the project in more detail and include some key code passages. The intention behind this is to allow you to easily adjust the scripts to your own needs.
Project Description #
Preparation #
If you want to follow along or analyze your own VPC’s flow logs, you first need to enable them in the AWS console (or the AWS CLI). The project loads flow logs from S3, so first make sure you have an S3 bucket with the correct access policies. If you don’t have an S3 bucket you want to use already, you can follow this tutorial by AWS to set one up for flow logs. In the following I will describe how to set up flow logs to capture traffic in the whole VPC. If you only want to analyze a single subnet or network interface, note that you need to adjust the flow log settings accordingly.
Next, navigate to the VPC section of the AWS console. Find the VPC you want to analyze and go to the “Flow logs” tab. Click “Create flow log”.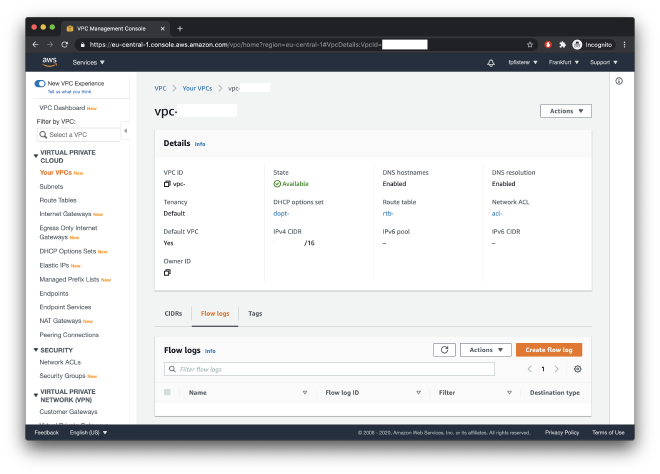
Select if you want to log accepted, rejected or all traffic. Logging rejected traffic can help you put light on which traffic is attempted but blocked by configurations like security groups. For the purpose of this analysis, I have logged only accepted traffic. (A cool feature one might to add to my tool is to log all traffic and then show denied traffic in a different color in the graph). As the destination, enter the ARN of the S3 bucket you want to use. This project uses the AWS default format, so leave the default option.
Once you’ve created the flow log, it starts to log VPC traffic in your network immediately. Validate it works by checking if there is data coming into your S3 bucket. It’s good to let it collect some data for some time so we have a representative sample to analyze, so let’s dive into the project in the meantime.
Environment Setup #
The script described in the following expects a .env file in the root directory with the following environment variables:
AWS_ACCESS_KEY=your-access-key
AWS_SECRET_ACCESS_KEY=your-secret-access-key
AWS_S3_BUCKET_NAME=vpc-flow-log-bucket-name
To create the AWS access keys, head to the IAM console and create a user that has at least read-only access to the S3 bucket you’ve created.
The Graph Generator #
The graph generator loads the VPC logs from S3 and prepares them so they can be used by the client. You can invoke it using npm run graph-generator, which calls the graph-generator/index.ts file and executes the full pipeline. Make sure you install the dependencies using npm install first.
Downloading logs from S3. The code in graph-generator/s3-download.ts downloads all files from the S3 bucket listed in the .env file into the data directory (with the same folder structure). AWS generates flow log records in .gz files, so this script also unzips the records and deletes the .gz files. To make the following steps easier, it also merges all flow log records together into one single .txt file, which is put in the logs directory.
An excerpt from this log file could be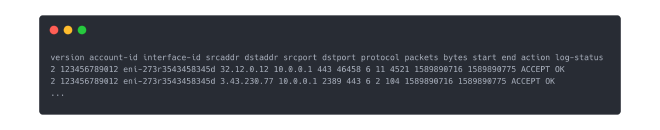
Parsing the logs. The code in graph-generator/reader.ts reads the merged log line by line and parses each row into an object of the following type:
type Request = {
    srcAddress: string;
    srcPort: number;
    destAddress: string;
    destPort: number;
};
As you can see in the log excerpt above, flow logs contain much more information that the source and destination addresses. However, for this simple graph visualization, we don’t need any additional information, so we dismiss it.
Generating the graph. Finally, the code in graph-generator/generate-graph.ts generates a graph in a .json file that the client can read and display. A graph consists of a set of nodes (or vertices) and a set of edges between these nodes. Here, I define the following types:
type Node = string;
type Edge = {
    src: Node;
    dst: Node;
    count: number;
};
Here, a node is just a string, which is usually just an IP address. An edge specifies the source and destination nodes and in addition contains a “weight” (count) that describes how often there was a network flow between the nodes (IP addresses).
The script receives a list of all requests (with source and destination addresses) from the previous step. It can perform some filtering to display only “relevant” traffic, by filtering out connections that occurred less than minOccurrencesThreshold times (e.g., 10) or only listing the topK edges in terms of how frequent there was a connection between to addresses. You can play around with these values in the script and see what works best for you.
The basis for a Node’s identity is formed by its IP address (and optionally, the port too). My script makes two adjustments:
- Replace known IP addresses: there are a few known IP addresses that I want to show with a descriptive name in the graph. Thus, the script checks if the IP address is listed in graph-generator/known-ips.ts and then replaces it by its alias. Examples include server instances, Redis cache instances, databases, load balancers. You can get the local IPs of these resources from the AWS console.
- Randomize all other IP addresses: for privacy and security purposes, the script randomizes all other IP addresses. It however maps the same IP address always to the same pseudo IP address. If for your purpose of analysis it’s important to have the correct IP addresses, you can leave out this step (in the
getNodefunction).
After the nodes and edges have been determined and cleaned up, the script stores a { nodes, edges } json in the graphs directory. In order to allow the client to easily access the latest graph file, it then creates a symlink from client/graph.json to the new graph file.
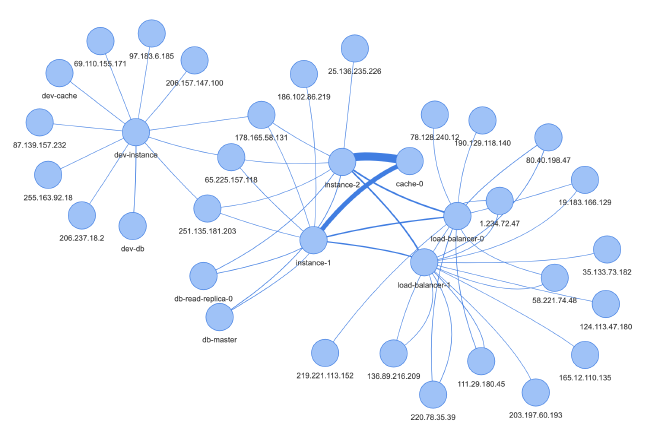
The following is an excerpt from the graph JSON file that generates the image in the top of this post: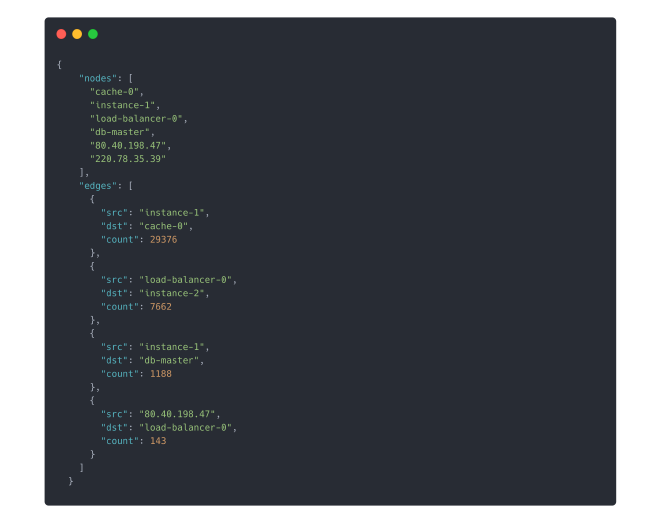
As you can see, some of the nodes (IP addresses) are named (e.g., load-balancer-0), which is accomplished by step 1 listed above.
The Client #
You can start a local web server serving the visualization of the graph using npm run client. It consists of an HTML file which loads the vis-network framework and then renders the graph, using the code from client/index.js. It loads the graph JSON from the client/graph.json symlink which the graph generator has created.
The graph visualization framework automatically distributes the noodes in a beautiful way. However, calling
network.setOptions({ physics: { enabled: false } });
2 seconds after rendering the graph allows you to move the nodes around so you can get your desired graph visualization. If you don’t disable physics, you can still drag the nodes around, but they will animate back.
Conclusion & Future Work #
VPC flow logs are an important feature of AWS that help you understand and monitor traffic in a VPC. To quickly get an overview over the traffic in a VPC, visualizing network flows in a graph can be a handy tool. The script introduced in this post is taylored for a specific use case: getting an overview of the most common traffic in a VPC that contains many resources.
However, if you want to adjust it to your own needs, you can grab the code from GitHub and play around with it. Some ideas that might be useful:
- add a distinction between allowed and denied traffic, and show denied traffic in the graph in red color
- write a script that continually monitors incoming logs, and alerts you about spikes in denied or unexpected traffic
- …
Feel free to submit a pull request if you’ve added some feature that you think others might find useful as well. If you need any help or consulting for your cloud architecture or backend project, or want me to look at your VPC logs, feel free to reach out!